
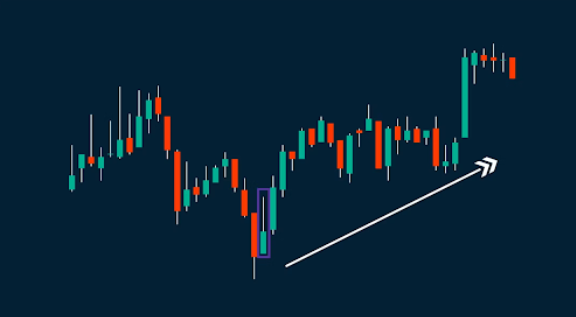
When diving into the world of trading and investing, you might often hear about candle chart patterns. If you’re a budding trader or just curious about how the market works, understanding these patterns is essential. They’re like the language of the stock market, offering insights into market sentiment and potential future movements. But don’t fret! We’re here to break it down for you—relatable and easy to digest.
What Are Candle Chart Patterns?
At the core of trading, candle chart patterns represent price movements over a specific period. Each “candle” reflects four main points: the opening price, closing price, highest price, and lowest price of a trading session. When combined, they form a visual representation that can tell us quite a bit about market behavior. Think of these candles as little stories—sometimes the story is bullish, and other times it’s bearish.
So where do these patterns come into play? Well, traders use them to predict future price movements. Whether you’re new to trading or already familiar with terms like non convertible debentures, understanding candle chart patterns can enhance your investing journey.
The Significance of Candle Patterns
Why should you care about candle chart patterns? Imagine you’re sitting in a café, and the barista is brewing coffee. You watch her every move; kneading the dough, pouring hot water, and finally, serving the best cup of cappuccino. Each action gives you insights into how your drink is made. Similarly, candle chart patterns provide insights into market behavior.
These patterns not only help you gauge the current market sentiment but also anticipate potential future movements. One well-formed pattern may signal a buying opportunity, while another could indicate time to sell. Understanding these signals is like having a secret weapon in the trading arsenal!
The Most Common Candle Patterns
Now, let’s get to the exciting part: the actual patterns! Here are some common candle chart patterns and what they might indicate.
1. Doji Candle
Have you ever watched a movie where the characters are in a dilemma? That’s what a Doji candle represents—a market caught between buyers and sellers. A Doji forms when the opening and closing prices are almost identical, indicating indecision. Traders look at this pattern to gauge market volatility. If you see a Doji after a strong uptrend, it might hint that a reversal is coming.
2. Hammer
The Hammer is like the superhero of candle chart patterns. Picture a massive storm with dark clouds, but suddenly, a beam of sunlight breaks through. A Hammer appears near a downtrend, signifying that buyers are stepping in, possibly ending the price decline. It typically has a small body and a long lower shadow, indicating buyers’ resilience despite the selling pressure.
3. Engulfing Pattern
Think of the Engulfing pattern as a dramatic takeover. This pattern involves two candles: a smaller candle followed by a larger one that completely ‘engulfs’ the first one. If it appears after a downtrend, it could signal a bullish trend reversal as buyers have taken control. Conversely, if it appears after an uptrend, it indicates a potential shift towards bearishness.
4. Shooting Star
Just as the name suggests, the Shooting Star is a bearish reversal signal. It forms after an uptrend, showing that buyers tried to push the price higher, but the sellers took over. Visually, it has a small body at the lower end of the price range and a long upper shadow—the story of a failed attempt to rise higher.
5. Morning Star
The Morning Star feels like the perfect come-back story. This bullish reversal pattern appears after a downtrend. It consists of three candles: a large bearish candle, a smaller one (which may be bullish or bearish), followed by a large bullish candle. This pattern suggests that the tide is turning, and buyers are beginning to take control again.
How to Use These Patterns in Your Trading Strategy
Now that you know some common candle chart patterns, how do you incorporate them into your trading approach? Here’s a quick guide:
- Confirmation is Key: Always look for confirmation before making a trade based on a pattern. For instance, if a Hammer candle appears, wait for the next candle to confirm the pattern’s message.
- Combine with Other Indicators: Don’t just rely on candle chart patterns. Use other trading indicators like moving averages or RSI to confirm your analysis.
- Risk Management: Just like deciding which movie to watch, ensure you plan your trades. Set up stop-loss orders to manage your risks, especially if you’re trading in volatile markets.
Understanding Market Sentiment
Each candle chart pattern gives you a peek into market sentiment. When buyers are in control, candles will often be green (or filled) and large, indicating enthusiasm and bullishness. When sellers dominate, you’ll see red (or empty) candles that represent a drop in price.
Learning to read these patterns ensures you have an advantage. You can anticipate trends and react accordingly—whether that involves buying, holding, or selling your investments.
The Bottom Line: Mastering Candle Patterns
Your journey into the world of trading should be exciting, not overwhelming. Mastering candle chart patterns is a critical step in navigating the stock market waters with confidence. As you study these patterns, keep in mind the dynamic nature of the market.
So grab a cup of coffee (or tea, if that’s your vibe), sit back, and start analyzing those charts. Remember, consistent practice and observation will sharpen your skills over time.
Just as with non convertible debentures—which can be a solid investment but come with their risks—understanding candle chart patterns can elevate your trading game. Embrace the learning journey, be adaptable, and soon you’ll find yourself reading the market like a book. Happy trading!